Intraday charts move fast, and without a fixed process it is easy to react to every candle. Technical analysis for intraday trading is the practice of reading price, volume and chart structure within a single session to plan trades that are opened and closed on the same day.
This guide explains how to do intraday technical analysis in a clear sequence: choosing timeframes, marking key levels, reading chart patterns, confirming signals with indicators, and planning risk before you enter.
Chart analysis does not predict the market. It helps you build a repeatable process and compare possible outcomes. Every setup can fail, so treat the methods below as a framework to practise and test, not as guaranteed signals.
Table of Contents
Key Takeaways
- Follow the same six steps every session: timeframes, trend, levels, setup, risk plan, review.
- Mark key levels first, and use indicators only to confirm what price shows.
- Fix your stop-loss and position size before you enter a trade.
- No pattern or indicator is guaranteed, so expect some trades to fail.
How Intraday Technical Analysis Works
Intraday trading technical analysis relies on short-term price behaviour rather than company fundamentals. A chart records the price traded in each time interval, along with the volume.
Traders study that record to understand who is in control (buyers or sellers), where price has reacted before, and how strong a move is.
Because the trading day has limited hours, intraday charts react quickly to news, opening-hour volatility and order flow. This makes them useful for short-term decisions, and also noisier than daily charts. A good analysis process therefore combines several pieces of evidence instead of relying on any single signal.
Market Hours and Intraday Positions in India
The Indian equity market opens at 9:15 AM. However, market closing times and closing auction sessions may vary across segments and are subject to regulatory revisions. To understand how the closing auction works and its role in determining closing prices, read our guide on the Closing Auction Session (CAS).
The first few minutes after the market opens often experience higher volatility as traders react to overnight news and pending orders. Brokers typically square off open intraday positions before the applicable market close. To avoid automatic square-off, check Share India’s intraday square-off timings and close your positions within the specified time if you prefer to manage your own exits.
Intraday Chart Analysis: A Step-by-Step Workflow
Follow the same order every session. Working through the chart in sequence keeps decisions consistent.
Step 1: Choose your Timeframes
Start with a higher timeframe, such as a 15-minute or 60-minute chart, to understand the broader direction and the major levels for the day. Then use a lower execution timeframe, such as a 1-minute or 5-minute chart, to time the entry.
There is no universal best timeframe. Shorter intervals give more signals and more noise; longer intervals are smoother but slower. Pick a pair you can follow comfortably and stay consistent. For a deeper understanding of how different trading hours and chart intervals influence intraday decisions, explore our guide to intraday trading timings.
Step 2: Identify the Trend
On the higher timeframe, check whether price is making higher highs and higher lows (uptrend), lower highs and lower lows (downtrend), or moving sideways.
Trading in the direction of the dominant trend is generally easier than trying to catch reversals, and a sideways market calls for a different approach from a trending one.
Step 3: Mark Key Levels
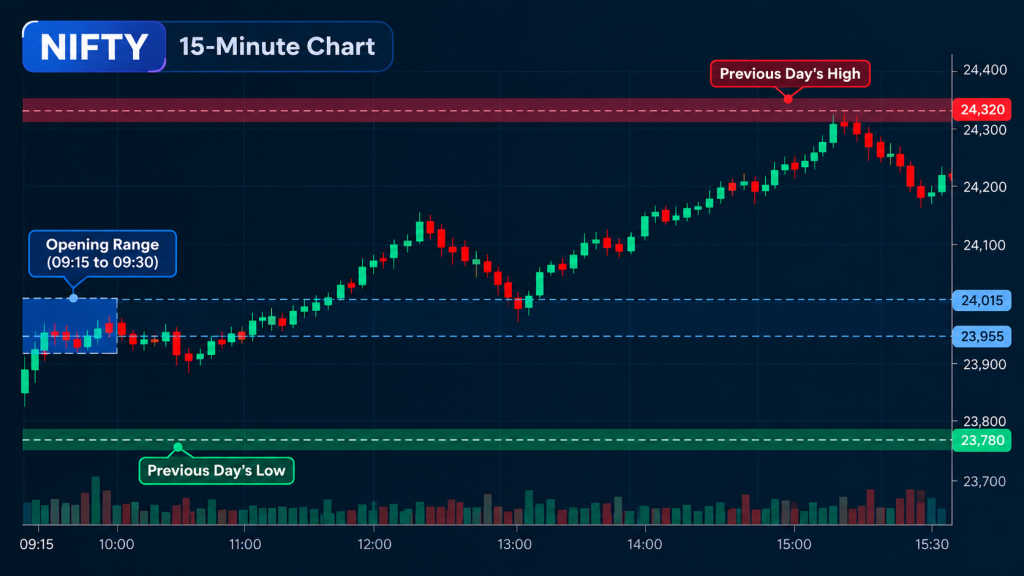
Draw horizontal zones where price has repeatedly paused or reversed, such as the previous day’s high and low and the opening range (for example, the high and low of the first 15 minutes after the 9:15 AM open).
Learning how to identify support and resistance helps you treat these as zones rather than exact lines. Candle structure also gives context at these zones, so it helps to read candlestick patterns alongside your levels.

Step 4: Look for a Setup and Validate It
A setup is a pattern or price reaction at a level you marked. Before acting, look for confirmation: a close beyond the level, a rise in volume on the move, or agreement from a relevant indicator. If these do not line up, waiting is a valid decision.
Step 5: Plan Entry, Invalidation and Exit
Decide in advance where the idea is proven wrong (invalidation), where you will exit if it is, and where you may book profit. Define the amount you are willing to lose before you place the trade, and let that determine your position size.
Example (illustrative): a hypothetical buy trade with 1% of capital at risk.
| Item | Value |
| Trading capital | ₹1,00,000 |
| Risk per trade (1%) | ₹1,000 |
| Entry price | ₹500 |
| Stop-loss | ₹495 |
| Risk per share | ₹5 |
| Position size (₹1,000 ÷ ₹5) | 200 shares |
Costs are not included. Brokerage, taxes and slippage add to the loss if the stop-loss is hit.
Our guide to stop-loss in intraday trading covers order types and placement in detail.
Step 6: Review and Learn
Keep a trading journal with a screenshot, the reason for the trade, the result and what you would change. Over time, the journal shows which setups and timeframes work for you and which do not.
Chart Patterns for Intraday Trading
Chart patterns for intraday trading are repeating shapes in price that traders use to frame a possible continuation or reversal. It helps to separate single-candle signals (such as a long-wick rejection candle) from multi-candle patterns that form over several bars.
A few patterns are enough to start with:
- Flag: A sharp move followed by a small, orderly pullback. A breakout in the direction of the original move, ideally with rising volume, is the usual confirmation. It fails if price falls back through the flag’s opposite side.
- Triangle: Price squeezes between converging trendlines as volatility contracts. Traders watch for a decisive close outside the triangle. A move that quickly returns inside it is a warning of a false breakout.
- Range breakout: Price consolidates between a clear high and low, then moves beyond one side. Volume expansion and a retest that holds the broken level add credibility. A close back inside the range invalidates the idea.
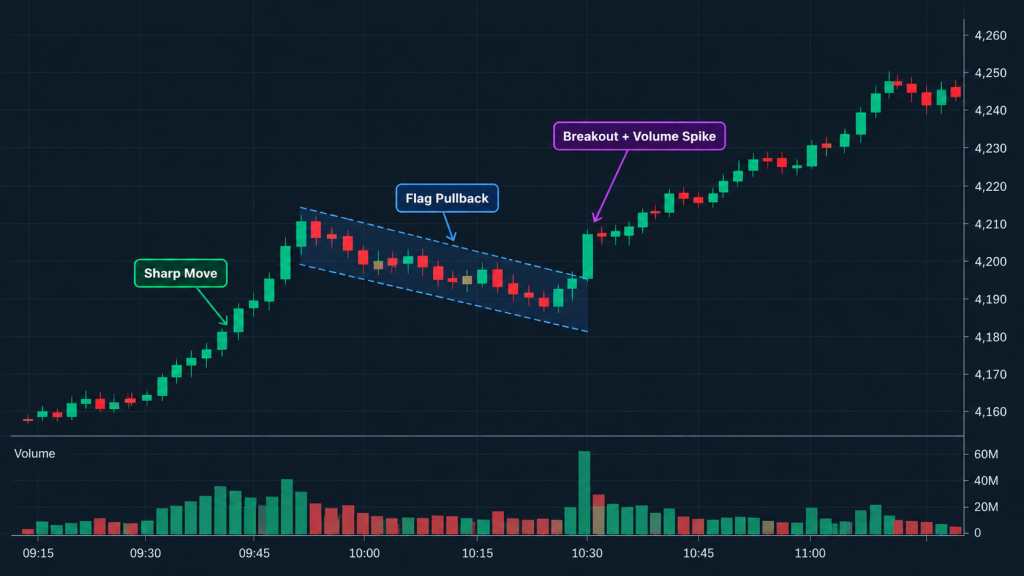
Patterns are probabilities, not promises. They work best at levels you have already marked and when they agree with the higher-timeframe trend.
For practical examples of how chart patterns can fit into trading plans, explore our guide to short-term intraday trading strategies.
How to Combine Indicators With Price Action
Indicators are calculations built from price and volume. Use price action and levels as your foundation, and assign each indicator one clear purpose rather than stacking several that say the same thing.
- Moving averages show trend direction and dynamic support or resistance. Crossovers are lagging evidence and can produce repeated false signals (whipsaws) in sideways markets.
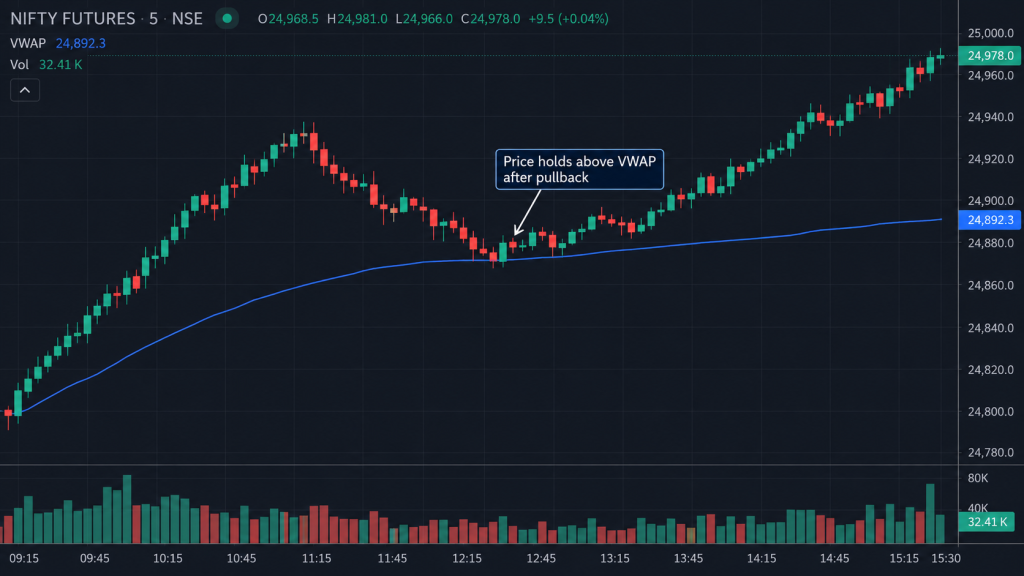
- VWAP (volume-weighted average price) shows the average traded price for the day, weighted by volume. It resets at the start of every session. Many intraday traders use it as a reference for whether price is trading above or below the day’s average.
- RSI (Relative Strength Index) measures momentum. Most platforms use a default period of 14. Readings near 70 or 30 describe overbought or oversold conditions, not automatic sell or buy signals, because in a strong trend these extremes can persist for a long time. Divergence between price and RSI can hint at weakening momentum and still needs confirmation.
- Bollinger Bands show volatility around a moving average. Price touching or closing outside a band does not guarantee a reversal; in strong trends, price can keep moving along the band. Read the bands with trend and levels.
- Volume shows participation. A breakout with strong volume is generally more convincing than one on thin volume.
- Fibonacci retracements are a drawing framework for identifying possible pullback zones. They are one input for planning, not a guaranteed target or entry.
For a deeper comparison of each tool, how it is calculated and when it tends to fail, read our guide to intraday trading indicators.
Tools for Chart Analysis
This process needs only a few charting features: multiple timeframes, drawing tools for levels and trendlines, volume and indicator panels, and price alerts so you can wait for a level instead of watching the screen all day.
Practice on a clean chart first, and add tools only when they answer a specific question.
Risk Controls and Common Mistakes
Technical analysis helps you decide where to act, but risk management decides how much a wrong decision costs. Tools themselves do not reduce market risk. Your discipline does.
- Set the planned loss first. Decide the maximum amount you will lose on a trade, then size the position from the distance between entry and invalidation.
- Account for slippage and costs. Fast-moving markets can fill your order away from the expected price, and brokerage, taxes and other charges reduce the result of small trades.
- Avoid overloaded charts. Too many indicators often give conflicting signals and lead to hesitation.
- Beware of false breakouts. A breakout that lacks volume, closes back inside the level, or occurs just before major news deserves caution.
- Test before scaling. Practise a setup over many trades before committing larger capital.
Limitations of Technical Analysis
Indicators lag price, patterns can fail, and indicators can disagree with each other. Sudden news, results announcements and economic events can override any chart setup within seconds.
Treat analysis as a way to organize decisions under uncertainty, and expect some trades to be wrong even when the process is sound.
Conclusion
Using technical analysis for intraday trading is about following a process: set the timeframes, read the trend, mark the levels, confirm the setup, plan the risk and review the result. Keep your chart simple, learn a small number of patterns well, and remember that no method removes uncertainty.
To explore more tools for market analysis and trading, visit Share India’s trading features.
This article is for educational purposes only and is not investment advice. Investments in securities market are subject to market risks. Read all the related documents carefully before investing.