If you have ever opened a stock chart on the National Stock Exchange of India and thought, “What am I even looking at?”, trust me, you are not the only one. In the beginning, candlestick charts look confusing. So many red and green candles, lines sticking out from both sides, prices moving every second. It can feel like everyone else understands it except you.
But the truth is, candlestick charts are much simpler than they look.
Once you understand what one candle means, the rest starts becoming easy. You stop looking at the chart as random movement and start seeing it as a story. You can tell when buyers are becoming stronger, when sellers are taking control, and when the market is unsure.
That is why traders use candlestick charts every day. In this guide, let us break it down in the easiest way possible.
Table of Contents
What Is a Candlestick?
A candlestick simply shows what happened to a stock price during a certain time.
That time can be one minute, five minutes, one hour, or one full day. Each candle tells you four things. It tells you where the price started, where it ended, what the highest price reached was, and what the lowest price touched.
The thick part in the middle is called the body. The thin lines above and below are called wicks.
If the price closed higher than where it opened, the candle is usually green. If the price closed lower than where it opened, the candle is usually red.
That is it.
Seriously. That is the whole foundation of candlestick charts.
Everything else you hear, all those fancy names and patterns, is just different combinations of these candles.
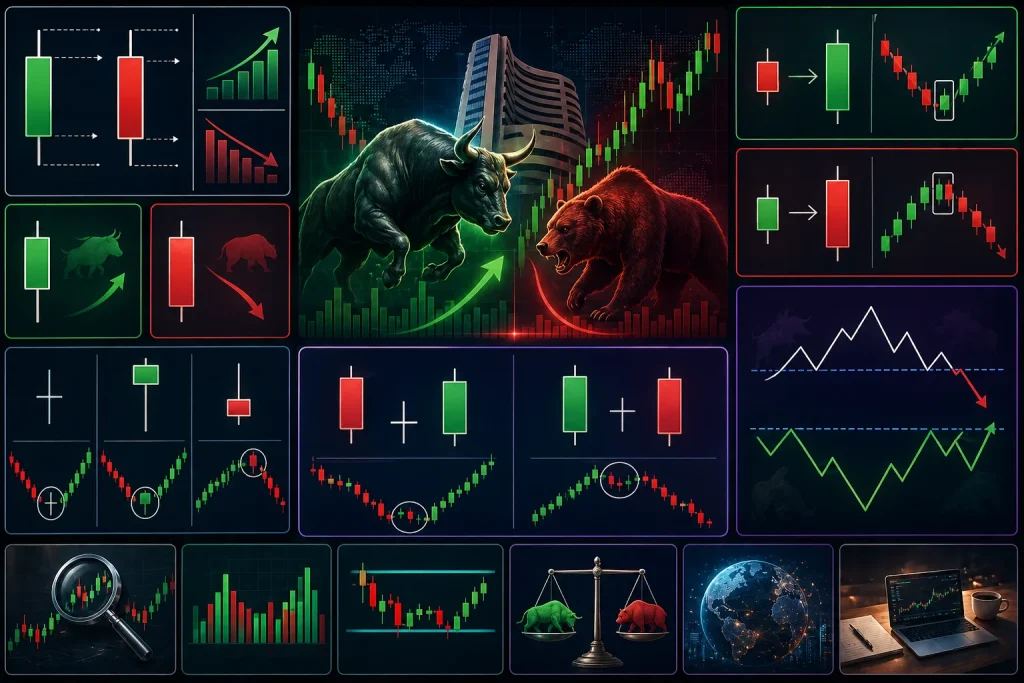
Single Candlestick Patterns
Let us start with the easiest ones. These patterns are made using just one candle.
Doji Candlestick
A doji forms when the opening price and closing price are almost the same.
So the candle body becomes very small, sometimes almost like a straight line.
What does that mean in simple words?
It means the market could not decide. Buyers tried to push the price up. Sellers tried to push it down. But in the end, neither side really won. That is why a doji often signals confusion or hesitation. If it appears after a strong rise, it can mean buyers are slowing down.
If it appears after a sharp fall, it can mean sellers are losing energy.
Think of it like two people pushing a door from opposite sides, but the door barely moves.
A doji alone does not mean you should instantly buy or sell. It just tells you something important is changing, and you should pay attention.
Hammer Candlestick Pattern
A hammer has a small body at the top and a long wick below. Sellers pushed the price down hard during the session, but buyers pushed it back up before the close.
It appears at the bottom of a downtrend and is one of the most reliable bullish candlestick patterns. Simply put, it says buyers are starting to fight back.
Shooting Star Candlestick
The shooting star is the opposite of the hammer. Small body at the bottom, long wick pointing upward. Buyers tried to push the price higher but got rejected.
It appears at the top of an uptrend and signals that the rally may be losing steam. This is a bearish candlestick pattern to watch carefully.
Double Candlestick Patterns
Two candles side by side can tell a much stronger story than one.
Engulfing Candle Pattern
This is one of the most popular double candlestick patterns among traders doing NSE candlestick pattern recognition.
A bullish engulfing pattern is a small red candle followed by a larger green candle that completely covers the previous one. It appears at the bottom of a downtrend and signals that buyers have taken control.
A bearish engulfing pattern is the reverse. A small green candle followed by a larger red candle. It appears at the top of an uptrend and signals that sellers have taken over.
The bigger the second candle is compared to the first, the stronger the signal.
Triple Candlestick Patterns
Three candles give you the clearest picture of all.
Morning Star Candlestick
The morning star candlestick is a three-candle bullish reversal pattern. Here is how it works:
The first candle is a long red candle. Sellers are in full control. The second candle is small, sometimes a doji. The market is confused, unsure. The third candle is a strong green candle that closes well into the first red candle’s body. Buyers have arrived.
This pattern forms at the bottom of a downtrend and is one of the strongest signals that a reversal is coming.
Evening Star Candlestick
The evening star candlestick is the bearish version of the morning star. Strong green candle, then a small, uncertain candle, then a powerful red candle closing deep into the first candle’s body.
It forms at the top of an uptrend. What was a confident rally starts to crack. When you spot this on a chart, it is worth taking note.
One Bigger Pattern Worth Knowing
Head and Shoulders Pattern
This one is not a candlestick pattern, but it works beautifully alongside candlestick analysis.
Three peaks form over time. The middle peak is the tallest, which is the head. The two on either side are roughly equal in height; those are the shoulders. A line connecting the two low points between the peaks is called the neckline.
When the price drops below the neckline, it signals a bearish reversal. The inverse version, an upside-down head and shoulders, signals a bullish reversal after a downtrend.
How to Actually Use These Patterns
Knowing a pattern is one thing. Using it well is another. A few simple rules to keep in mind:
Look at where the pattern forms. A hammer at the bottom of a long decline means much more than a hammer appearing randomly mid-chart. Context is everything.
Check volume. When a strong pattern forms on higher-than-usual volume, the signal is more reliable. Volume shows you that real participation is behind the move.
Do not rely on one pattern alone. Combine candlestick signals with basic support and resistance levels. When a morning star forms right at a strong support zone, that combination carries serious weight.
For candlestick patterns in intraday trading in India specifically, keep an eye on broader market cues too. Global markets, major economic announcements, and FII activity all influence how cleanly patterns play out on the NSE.
Candlestick analysis is not magic. It is a way of reading the balance between buyers and sellers at any given moment. The patterns give you clues. Your job is to put those clues together with everything else you know about the market.
Start simple. Learn the doji, the hammer, and the engulfing candle pattern first. Spend time on real charts. The patterns will start jumping out at you naturally, and reading a candlestick chart on the NSE will stop feeling like a challenge and start feeling like second nature.
Disclaimer:
This article is for educational purposes only and does not constitute investment advice. Please consult a SEBI-registered financial advisor before making any trading or investment decisions.