Analyse Company Fundamentals with Share India

Beyond the Price Chart: Understand the Business

Every stock has a story the price alone won’t tell you. Explore company fundamentals, financial performance and AI-powered insights with Share India to make fundamental analysis of stocks simpler and research with greater clarity. 

India +91
*T&C Apply
Company Fundamentals Gif Image

AI-Powered Stock Analysis

What Lies Beyond the Numbers? Let AI Uncover the Insights.

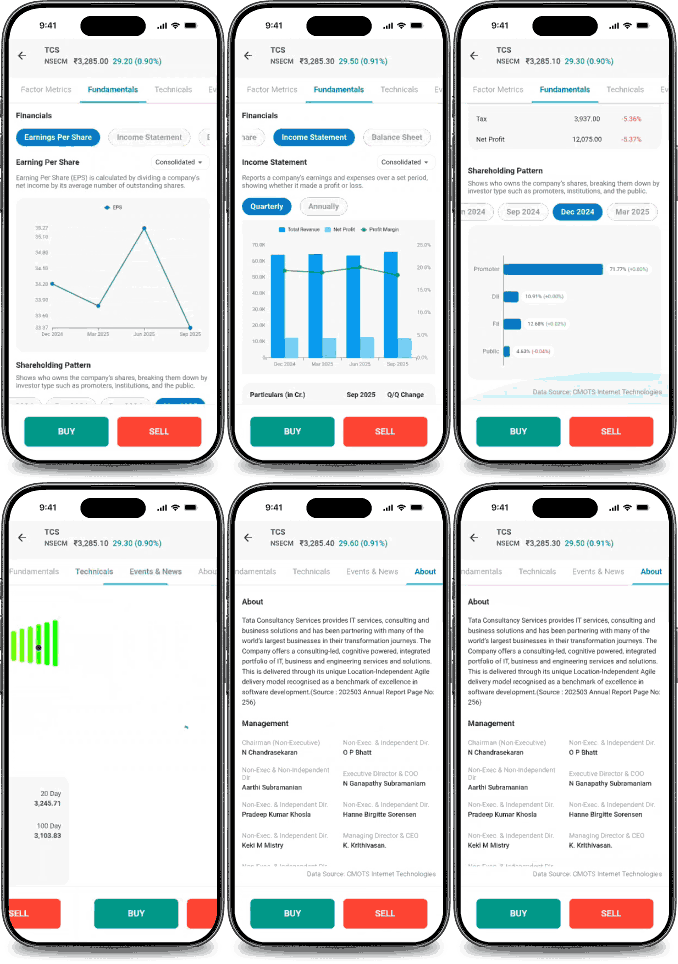
Company research often means moving between multiple screens and data points. Share India’s AI stock analysis brings key information together in a structured view, helping you research listed stocks with less effort. Get a complete view with:

Company Fundamentals Icon

Company Fundamentals Snapshot

key icon

Key Stock Insights, Ratios & Overall Score

Nodes Icon

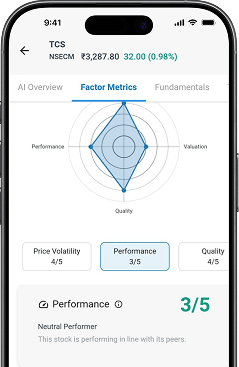
Factor Metrics

clipboard clock

Historical Performance Snapshots

Corporate Event Icon

Corporate Events & Relevant Updates

Chart Pie Logo

Shareholding Pattern

hugeicons document code

AI-Generated Stock Summaries

Compare outline Icon

Peer Comparisons

mtf right corner icons
What Are Company Fundamentals image

What Are Company Fundamentals

Company fundamentals are the core numbers and information that help show how a business is performing—its profits, how efficiently it operates, how much debt it carries and how its stock is valued. They can be studied through financial statements, key financial ratios, historical performance and relevant comparisons.

Why Fundamentals Matter

Fundamental analysis helps you look beyond stock-price movements and understand the underlying business. It can help you assess a company’s growth, profitability, financial health and valuation, providing greater context for your investment research.

Key Company Fundamentals to Check

Instead of looking at every number separately, start with what you want your company's financial analysis to tell you.
You want to know Key Metrics What it tells you
Is the company growing?
Revenue growth, profit growth, EPS growth
How the business is growing over time
Is it profitable?
Profit margins, ROE, ROCE
How effectively the business generates profits
Is it’s debt manageable?
Debt, debt-to-equity
Its debt position and leverage
Is it using capital efficiently?
ROE, ROCE
How efficiently the company uses its capital
How is the stock valued?
P/E and relevant valuation ratios
How its valuation relates to financial measures
Who owns the company?
Shareholding pattern
Promoter and institutional ownership

Looking at these company fundamentals and financial ratios together can provide a broader view of the business than relying on a single metric.

 Fundamental Analysis in Action

See how the same numbers tell a different story.
Chart candlestick icon

One strong quarter?

PE Icon

P/E looks high or low?

icon park outline building one

Comparing similar companies?

search icon

Stock price is rising?

Fundamental Analysis vs Technical Analysis

The difference between fundamental analysis and technical analysis lies in what each examines. 
Aspect Fundamental Analysis Technical Analysis

Answers

What does the underlying business look like?
What is happening in the stock’s price?

Focus

The underlying business
Price and market behaviour

Uses

Profits, debt, valuation, financial ratios
Price, volume, charts, patterns

Helps you

Assess financial health, performance and valuation
Analyse price trends and potential trading setups

Neither approach guarantees an investment outcome; each provides a different perspective for stock research.

Want to understand the concepts behind evaluating a company’s financial health? Learn how fundamental analysis works and the factors investors commonly examine.

Frequently Asked Questions

Which financial ratios should beginners focus on?

Beginners can start with a few widely used financial ratios and growth indicators. P/E provides context on valuation, while ROE and ROCE provide different perspectives on how efficiently a company uses capital, while debt-to-equity helps assess leverage. Revenue and profit growth can show how the business has performed over time. No single ratio gives a complete picture, so consider these indicators together, alongside historical performance and relevant peer comparisons.

Can fundamental analysis predict stock performance?

No. Fundamental analysis helps assess a company’s financial performance, profitability, debt, efficiency and valuation, but it cannot predict future stock-price movements or returns with certainty. Stock prices can also be influenced by market conditions, economic developments, industry changes, company announcements and investor sentiment. Fundamental analysis is therefore better used to understand the underlying business and add context to stock research rather than as a way to predict future price movements.

Can a company have strong fundamentals but a falling stock price?

Yes. A company may show healthy profits, manageable debt and consistent business performance while its stock price falls. Market prices are influenced by more than company fundamentals and may react to investor sentiment, economic conditions, industry developments, company-specific news or changing expectations. This is why fundamental analysis focuses on understanding the underlying business, while stock-price movements provide a different view of how the market is currently responding to the company.

How often should you review a company’s fundamentals?

Company fundamentals can be reviewed when new financial results become available or when significant developments affect the business. Quarterly and annual results can help track changes in revenue, profits, margins, cash flow and debt over time. Major acquisitions, management changes, regulatory developments or changes in the company’s operating environment may also provide reasons to revisit your research. The appropriate frequency ultimately depends on the purpose of the analysis and the information available.

faq image