Advanced Charts For Market Analysis
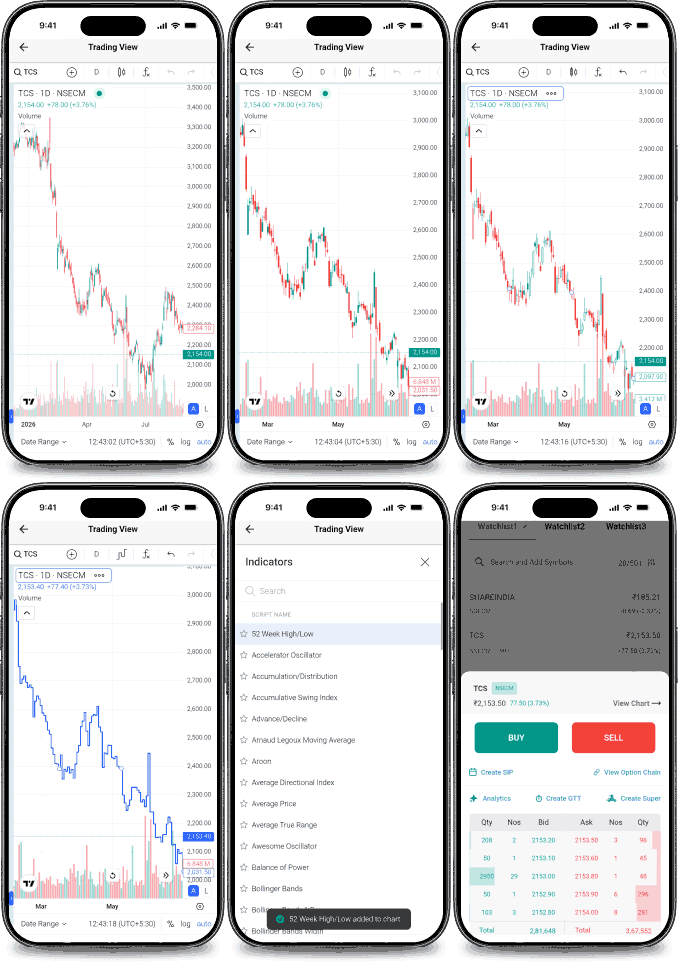
What if the price movement is only the beginning of the story? Study live market movements with TradingView-powered Trading Charts, built into Share India’s trading platform. Apply multiple indicators across equities, indices, F&O and commodities.
Go Beyond The Price Movement
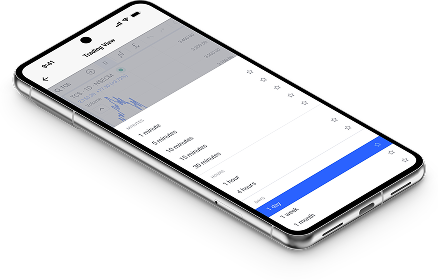
A trading chart shows how the price of a stock or instrument has moved over time. Advanced Charts give you more ways to examine that movement. Use technical indicators to study trend, momentum, volatility and market activity, and switch between available date-range views – 1D, 5D, 1M, 3M, 1Y and 5Y – to examine price behaviour across different periods.
Different Indicators, One Chart.
Look Beyond a Single Market Reading.
One indicator shows you only one side of the market.
-
Trend
Tells you where - the direction of the move.
-
Momentum
Tells you how strong - the pace behind it.
-
Volatility
Tells you how wide - the degree of price movement.
-
Market Breadth / Activity
Tells you how active - the participation behind the move.
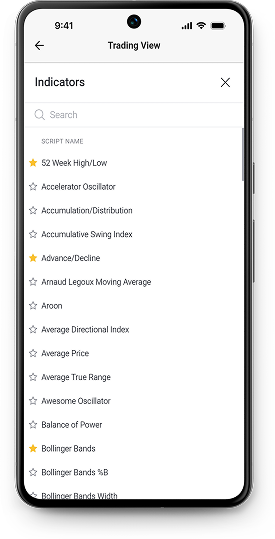
With Share India Advanced Charts, apply multiple technical indicators from a library of 100+, including RSI, Bollinger Bands, Stochastics, and MACD. Bring complementary readings together instead of viewing each one separately.
Build Your Analysis Setup
Your chart setup can change depending on what you want to study.
Layer Your Indicators
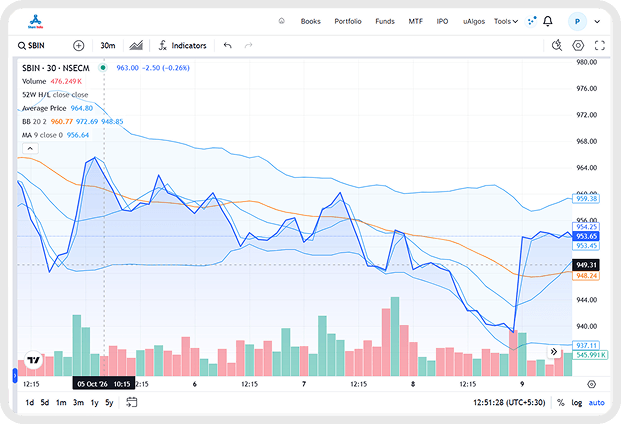
Use multiple indicators on one chart and view their readings alongside price movements – a simple form of indicator layering.
Customise Your Indicators
Adjust available indicator settings and parameters to build an indicator combination around your analysis.
Organise Your Chart View
Create a workspace by adjusting layouts, colours and chart appearance, around the way you read the market.
Save Your Setup — Coming Soon
A future update will let you save your preferred chart layouts & supported settings for easier access to your analysis setup.
Advanced Charting With Tradingview
Share India integrates TradingView Advanced Charts technology directly into its platform, bringing charting capabilities into the environment where you follow the market.
Live Market Data
Study market movements using live data from NSE, BSE and MCX.
Wide Market Coverage
Analyse equities, indices, F&O and commodities from the same charting environment.
No Separate Charting Platform
Access Trading Charts within Share India without moving to a separate charting site or switching between platforms.
*Advanced Charts are available to Share India clients without a separate charting subscription or additional charting charge.
Build Around What You Want To Analyse
Advanced Charts let you adapt your indicator combination and chart view based on what you want to study.
Following Intraday Movement
Use technical indicators to follow momentum, volatility and price movement as the trading session develops.
Studying Trends
Combine indicators focused on direction and momentum to study how a market trend is developing.
Watching Breakouts
View price movement alongside momentum and market activity to add context when examining a breakout.
Studying Market Extremes
Compare momentum readings with the broader trend when examining overbought or oversold market conditions.
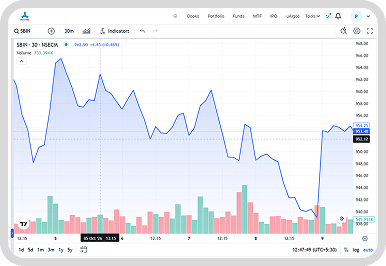
Your Charts, Your Way To Analyse.
Bring live market data, technical indicators and flexible date-range views together with Share India Advanced Charts. Customise your charts, combine indicators and shape your analysis setup around what you want to study.
Disclaimer: Technical indicators and charting tools are analytical tools and do not guarantee trading outcomes. Market conditions can change, and their readings should be considered alongside independent analysis and appropriate risk management.
Frequently Asked Questions
What is the difference between a basic stock chart and an advanced trading chart?
A basic stock chart primarily shows how the price of a stock or other instrument has moved over time. An advanced trading chart adds tools that help you examine those movements in greater detail.
With Share India Advanced Charts, you can use technical indicators, drawing tools, multiple timeframes and chart customisation options to study trends, momentum, volatility, market breadth and price behaviour. This makes Advanced Charts useful for deeper technical analysis rather than simply viewing historical price movement.
What technical analysis tools are available in Share India Advanced Charts?
Share India Advanced Charts bring together different technical analysis tools within the trading platform. These include 100+ technical indicators, drawing tools, multiple timeframes and chart customisation options.
You can use indicators to study different aspects of market behaviour, drawing tools to mark levels and price structures, and different timeframes to examine how price movement changes across shorter and longer periods.
What are technical indicators in trading?
Technical indicators are analytical tools that use market data to help traders examine different aspects of price behaviour. Depending on the indicator, they can provide readings related to trend, momentum, volatility, market breadth or activity.
Share India Advanced Charts provide 100+ technical indicators, including RSI, Bollinger Bands, Hull Moving Average, Historical Volatility and Advance/Decline. Indicators are analytical tools and do not guarantee trading outcomes.
Can I use multiple technical indicators on the same chart in Share India?
Yes. Share India Advanced Charts allow you to apply multiple technical indicators on one chart and view their readings alongside price movements.
This form of indicator layering allows you to bring different market readings into the same analysis setup. For example, you may use indicators that examine trend alongside indicators focused on momentum or volatility rather than viewing each reading separately.