 Overview
 Leadership
 CSR
CSR Equal Steps
 ESG
ESG News Room
 Investor Relations
 ISO Certification
 Calculators
 Margin Calculator
 Dividend Yield Calculator
 Options Calculator
 CAGR Calculator
 Trade Cost Calculator
 Trading Brokerage
 Demat Account Charges
 Other Trading Charges
Over the years, options trading has become a vital activity that allows investors to speculate on the price of an asset or to hedge against potential losses. The options market, however, varies significantly from one country to another in terms of volume, trading mechanisms, and market structure. In fact, some statistics can be misleading and may not tell the whole story, just like the one below.
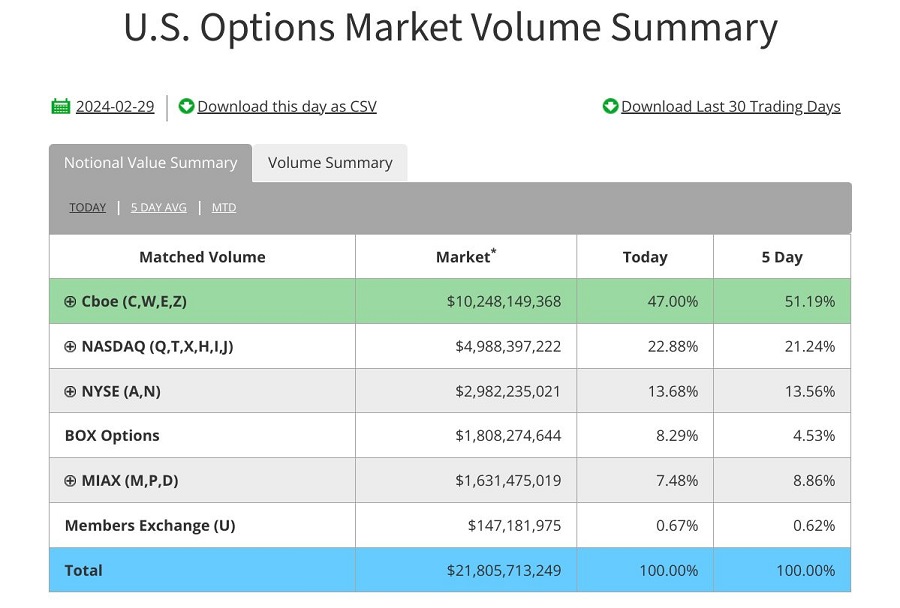
Source: https://www.cboe.com/us/options/market_statistics/
It necessitates a deeper understanding of the nuances between markets such as the United States and India, especially in the context of how options volumes are measured and the underlying dynamics at play.
Table of Contents
Understanding the Trading Volume Numbers
Firstly, it’s imperative to understand that the reported $22 billion volume is a genuine reflection of the US options market’s activities rather than merely representing the premium paid on options. Therefore, rather than indicating a lower level of market activity, the figure underscores the specialised nature of the country’s options market and its distinct operational framework, which is further explained below.
Market Structure and Liquidity
The second thing to note is that the structure of the options market in the United States is distinct from that in India. In the US, the number of contracts is significantly higher, partially due to the prevalence of daily expirations. However, liquidity presents a different picture and is much lower. For instance, S&P options in the US market display liquidity during US trading hours, often showing a bid-ask spread of three ticks, in contrast to India’s tighter spread of a single tick. This discrepancy highlights the concentrated liquidity within specific time frames and the broader market dynamics influencing trading strategies.
Furthermore, the US market incorporates a Request for Quote (RFQ) system, allowing traders to solicit tighter bid-offer spreads from market makers. This system underscores a more dynamic interaction between traders and liquidity providers, aiming to enhance market efficiency.
Options Settlement and Open Interest
Another critical difference lies in the settlement of in-the-money contracts. In the US, these contracts are automatically converted to futures at expiry, diverging from India’s cash settlement approach. This mechanism influences traders’ strategies, particularly in managing positions towards expiration.
Moreover, despite the appearance of lower trade volumes, the US options market exhibits higher open interest, indicating a larger number of open contracts that may be rolled over to subsequent periods. This phenomenon suggests a propensity for carry trades, where traders extend their positions across days, weeks, or months, contrasting with more frequent trading activities in other markets.
Selling Order Flow and Market Volume
The practice of selling order flow to market makers (specific to the US market), while factored into the $22 billion figure in the picture for example, does not significantly impact market volumes. Instead, it represents an off-exchange matching process, supplementing the on-exchange trading mechanisms without diluting overall market liquidity. This process underscores a nuanced aspect of market structure, where different channels contribute to the overarching trading ecosystem.
Summing Up
So, while initial impressions might suggest a disparity in market vibrancy based on trading volume alone, a deeper exploration reveals a complex interplay of factors that define each market’s unique characteristics. The apparent low volume of $22 billion in US options highlights the necessity of understanding the underlying metrics and mechanisms at play. Therefore, as investors and traders, it is important to interpret market data accurately. It’s far too easy to take things at face value!