
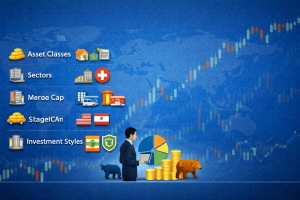
In the financial world, choosing the right investment product is crucial. It is not merely about saving money but also about the security of principal, liquidity, risk, return on investment, inflation, and achieving financial goals. Each investment performs differently in terms of potential return, risk exposure, liquidity, and taxation; therefore, before making any investment decision, […]
Introduction Traditional trade execution (buy and sell) in the stock market is evolving day by day with the advancement of technological development. Now, Traders / Investors expect trading tools that not only execute trades but also assist in minimising risk and help in decision-making strategies. To fulfil this objective, Share India introduced an advanced trading […]

Most investors spend their energy picking stocks. Which company. Which sector. Which quarter to buy? Hours of research, screener filters, earnings call transcripts. And then they deploy all of that into a portfolio structure that they spent maybe twenty minutes thinking about. That is the wrong order of operations. Completely. Research going back decades, including […]
There is a particular kind of financial pain that comes not from a bad trade, but from a good one that went bad at the worst possible time. You researched the company. The numbers made sense. The sector was doing well. And then something nobody predicted happened, and the stock fell 35% in a month. […]
Ask someone what the stock market looked like twenty years ago, and the picture that comes to mind is fairly consistent. Brokers on phone calls. Order slips. Blackboards. A lot of noise and a lot of waiting. Even as electronic trading came in and the noise moved off the floor and into data centres, the […]

Many traders face the same issue: You can know exactly what the right decision is and still not make it. You can have a clear plan, a defined stop-loss, an entry rationale you wrote down the night before, and still, in the moment, do the opposite. Not because you forgot the plan. Because something else […]

Most traders have an intuitive sense of what a trading strategy looks like. You look for a pattern. You define an entry. You set a stop-loss and a target. You repeat. The discipline is in the consistency of execution, not in the sophistication of the idea. That is a reasonable framework. It is also increasingly […]

Picture this. It is 9:16 AM. The market opened just minutes ago. A macro data release just landed, and three stocks you have been watching for weeks are already moving. By the time you process what happened, pull up the chart, and decide what to do, the move is done. The opportunity evaporated while you […]

Introduction — The Mystery Behind Market Swings Every investor, at some point, has asked the same question: Why did the market move today? One day stocks rally despite weak news, and another day they fall even when the economy looks strong. This often creates the impression that markets are unpredictable or even irrational. But market […]

Beginning an investment journey is a significant financial step that often brings both opportunity and uncertainty, especially for new investors exploring multiple financial avenues. One of the key choices beginners must make is whether to invest directly in individual stocks or to participate through mutual funds. Although both options aim to support long-term wealth creation, […]
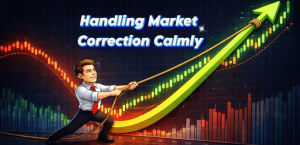
Staying Steady in Stormy Markets: A Smart Investor’s Guide to Corrections Rahul opened his trading app on a quiet Monday morning, coffee still warm beside his laptop. Within seconds, his screen filled with red. Nifty was down. His portfolio was bleeding. WhatsApp groups buzzed with panic. News channels flashed words like “sell-off” and “global uncertainty.” […]

The Demat account number is a 16-digit unique identifier assigned to investors when they open a Demat account with a security depository, stockbroker, or any other financial institution. What Is a Demat Account & Why Is It Important? A Demat account holds all the securities (shares, bonds, mutual funds, etc.) in a single consolidated electronic format. It simplifies the process of […]
 Overview
 Leadership
 CSR
CSR Equal Steps
 ESG
ESG News Room
 Investor Relations
 ISO Certification
 Calculators
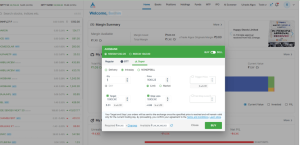
 Margin Calculator
 Dividend Yield Calculator
 Options Calculator
 CAGR Calculator
 Trade Cost Calculator
 Trading Brokerage
 Demat Account Charges
 Other Trading Charges