 Overview
 Leadership
 CSR
CSR Equal Steps
 ESG
ESG News Room
 Investor Relations
 ISO Certification
 Calculators
 Margin Calculator
 Dividend Yield Calculator
 Options Calculator
 CAGR Calculator
 Trade Cost Calculator
 Trading Brokerage
 Demat Account Charges
 Other Trading Charges
To make profits in the capital markets, different traders adopt different strategies and trading styles. One of the most common yet effective trading strategies among the several hundred trading strategies is trend trading. The trend trading strategy is a strategy that revolves around capturing gains by analysing the momentum of an asset’s price. To put it in simpler words, in the financial markets, a ‘trend’ is the general direction of movement of the larger market or the asset’s price. So, traders that trade, looking at trends, take long positions when the price of the asset is appreciating over a particular time horizon. On the other hand, they go short when the price depreciates over a period of time.
Table of Contents
How to identify a trend?
So, how could you start trading with the trend? In order to learn and practise trend trading, you first have to learn how to identify a trend. The first thing you need to note is that you identify a trend with respect to a specific time frame. That said, there are three types of trends: uptrends, downtrends, and sideways trends. You may have stumbled upon the terms ‘bull’ and ‘bear’ markets. Now, bull markets denote uptrends, and bear markets denote downtrends. To understand the subject better, consider performing this simple exercise.
Uptrend
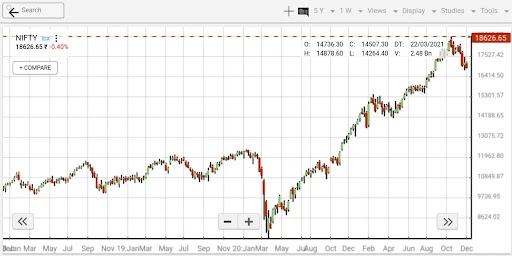
Download a trading app like Share India and view the 5-year price chart for the Nifty 50. You will see that there have been ups and downs. However, the general direction of the price is upwards, so you can conclude that the Nifty has been in an uptrend for the past five years.
Sideways Trend
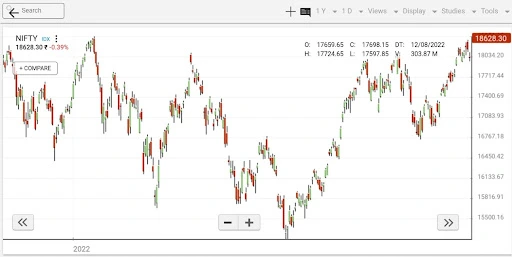
Now, if you zoom in and look at the 1-year chart of the Nifty 50 (Dec 2021–Nov 2022), you will see that the price of the Nifty has been fluctuating within a range. It did not make new highs, nor did it make continuous lows. This type of trend is called a sideways trend.
Downtrend
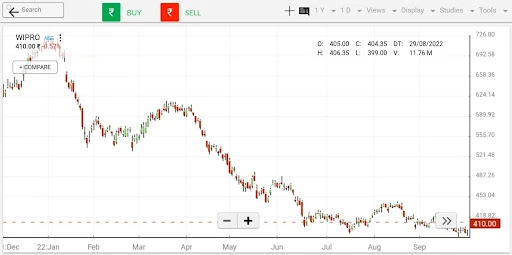
Now, to learn about a downward trend, look at the 1-year chart (Dec 2021–Nov 2022) of the Indian IT company Wipro. Just by glancing at it, you will see that the price is making continuous lows. So, you can draw the conclusion that Wipro has been in a downtrend for the past year.
Why is the Trend Trading Strategy Successful?
There is a popular saying among traders that goes, “Don’t fight the tape”. The phrase essentially means “don’t challenge the market” and “don’t trade against the current trend. To draw an analogy, a pilot will have a much more difficult time flying a plane against the direction of the wind than flying it in the direction of the wind. Trading is similar in that making profits is easier when your positions are aligned with the overall trend.
Hence, during bull markets, when the markets are trending upward, investors make money on their investments. Likewise, during a bear phase or a downtrend, short sellers are one way to profit. So, trend trading demonstrates that during an uptrend, a long position is the best way to make profits. During downtrends, it is the shorts that generate profits. As per your trend trading strategy, if the prevailing trend is an upward trend, do not take short positions. When implementing a trend trading strategy with CANSLIM stocks, it’s important to align your positions with the prevailing trend.
The Top 3 Indicators for Trend Trading
In technical analysis, you can think of technical indicators as signals derived from mathematical calculations based on factors like the price and volume of a security. Trend indicators are those indicators that help traders identify the trend over a specific time horizon. So, let us look at some of the most popular indicators you can use for trend trading.
Moving Averages
The moving average (MA) indicator displays the average price of a security over a specific time frame. When you apply this indicator to the price chart, a smooth curve is plotted on the chart. However, remember that the moving average is a lagging indicator; it uses data to portray what has happened and does not predict the future. That said, you can use two moving averages—a short-term moving average and a long-term moving average—to identify trends.
When the short-term moving average line is above the long-term moving average line, it can indicate an uptrend. Conversely, if the long-term moving average is above the short-term moving average, the price may be in a downtrend. The further apart the two moving averages, the stronger the trend.
Moving Average Convergence Divergence (MACD)
The moving average convergence and divergence (MACD), an oscillating indicator, is another popular trend trading indicator. This trend trading indicator fluctuates over time within a band. When the MACD bands are above the zero mark on the band, it is an upward trend. On the other hand, if they are below the zero mark, the trend is downward.
Relative Strength Index (RSI)
The last indicator that you can refer to as a trend trading indicator is the RSI or the relative strength index. The RSI, like the MACD, is another oscillator; however, in the case of the RSI, the band spans from 0 to 100. During a strong uptrend, the price should remain above the 70 level on the RSI. Meanwhile, during a downtrend, it sustains below the 30-level mark.
Conclusion
As a trader executing a trend trading strategy, there are various approaches you can take to ride the trend. In an ideal scenario, a trend trader will look to time their entry at the beginning of the trend and book profits at the trend’s climax. However, that is not very realistic, so find a good entry and book timely profits. Generally, most traders who ride the trend look forward to riding it for the medium to long term; however, that is not a compulsion. Lastly, as a trader, regardless of your style or approach, always have a risk-management plan in mind. Even seasoned traders may fail to foresee a trend reversal.