 Overview
 Leadership
 CSR
CSR Equal Steps
 ESG
ESG News Room
 Investor Relations
 ISO Certification
 Calculators
 Margin Calculator
 Dividend Yield Calculator
 Options Calculator
 CAGR Calculator
 Trade Cost Calculator
 Trading Brokerage
 Demat Account Charges
 Other Trading Charges
The 200-Day Moving Average (200-DMA) is a widely used indicator in financial markets, serving as a key tool for technical analysts and traders. This moving average, calculated by averaging an asset’s closing prices over the past 200 days, is renowned for its ability to smooth out price fluctuations and identify overall market trends. Understanding the principles and functionality of the 200-DMA is essential for investors seeking insights into the long term performance of a security. Read on to learn how it plays a crucial role in market analysis and trading strategies.
Table of Contents
Meaning of 200-Day Moving Average
The moving average is a technical indicator used in stock markets that helps to smooth out the volatility of security prices. It is calculated by taking the average price of a security over a certain period of time, and then plotting it on a chart. This provides investors with an overview of how the stock has been performing.
- Moving averages play a crucial role in helping traders identify trends and determine entry and exit points for trades.
- They provide insights into market sentiment, with rising moving average lines suggesting positive sentiment and potential buying pressure. Conversely, falling moving average lines indicate negative sentiment and potential selling pressure.
- The 200-day simple moving average (SMA) is a long term moving average, considering data from the last 200 days. Crossing above the 200-day SMA may signal an uptrend while crossing below it could indicate a downtrend.
- Bounces off the 200-day SMA may serve as support or resistance, depending on the position relative to the line.
Importance of 200-Day Moving Average
The 200-DMA is an important calculation of an asset’s long term trend. This metric shows the average price of a security over the last 200 trading days and can be used to identify important support and resistance levels. By looking at a security’s performance over a long period of time, investors can get better insight into potential opportunities for capitalising on both short term and long term trends.
For example, when the price of an asset is above its 200-DMA it may indicate that the current trend is up and could potentially continue in that direction. On the other hand, if the price falls below its 200-DMA it may suggest that there has been a change in sentiment which could then lead to further bearish momentum. Additionally, traders often use crossovers between shorter term moving averages like 50 or 100 days and their 200-day moving average as an indication of significant market changes.
Note that monitoring your assets’ performance relative to their respective 200-DMAs will give you better insight into how prices are trending and help you assess whether certain investments are worth making.
Example of 200-Day Moving Average
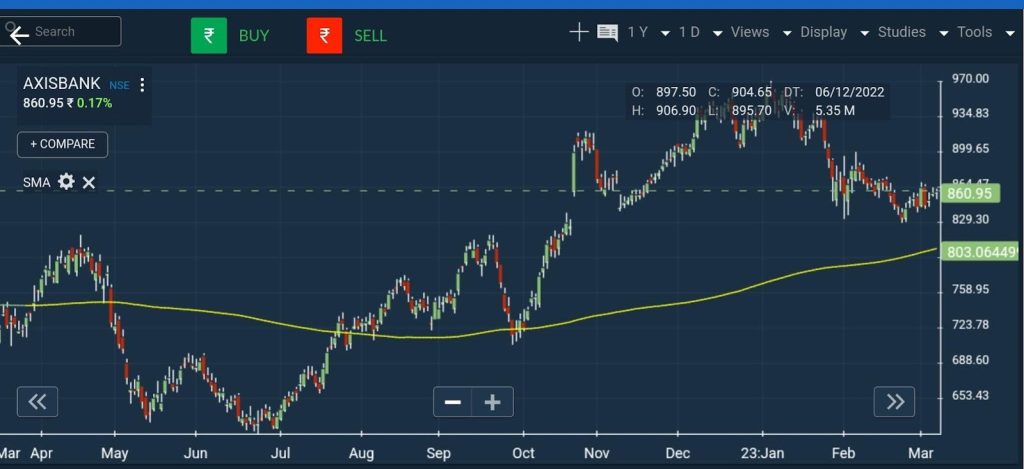
In the above example of Axis Bank stock, when you add a 200-day moving average indicator, you can see the yellow line, which represents the SMA of the 200-day period.
Importance of 200-Day Moving Average
Traders utilise various indicators for distinct purposes, with trend indicators providing insights into upcoming trends in the stock market. Stock analysis unveils the performance of stocks in relation to the moving average, shedding light on the status of companies either excelling or lagging. This analysis contributes to assessing the overall health of the market and gauging trader sentiment. Two lines, indicating the support and resistance levels of security, play a crucial role in understanding market dynamics. Further details about these lines are explored in the following section.
Support and Resistance in Moving Averages
The MA trend line tells the trader about the price levels that have not reached their potential. The price of securities will reflect a strong indication of the upcoming trend, which doubles up as a reliable support and resistance level.
Consider an example where the 200-DMA trend line shows the trend is going upwards. Traders will exit when prices deflect off the trend line, which doubles up the level of support. In this scenario, traders will think that the price has already bottomed out and will now likely rise. However, if the price rises sharply, the trader may take that as a hint of a trend reversal in the upcoming change in price. As a result, when there is a sharp downward trend, it can be a signal of price changing in an upward direction.
Conclusion
The 200-day moving average is a key tool for traders and investors alike, offering insights into long term market trends. It helps gauge sentiment, with a crossover above signalling potential uptrends and below suggesting possible downtrends. Additionally, the 200-DMA can act as a support or resistance level, providing valuable reference points for decision-making. Understanding its dynamics and incorporating it into market analysis enables traders to make informed choices, enhancing their ability to navigate the complexities of the financial markets.