 Overview
 Leadership
 CSR
CSR Equal Steps
 ESG
ESG News Room
 Investor Relations
 ISO Certification
 Calculators
 Margin Calculator
 Dividend Yield Calculator
 Options Calculator
 CAGR Calculator
 Trade Cost Calculator
 Trading Brokerage
 Demat Account Charges
 Other Trading Charges
Like any field of activity, stock trading is also based on a set of very unique and specific terms. The stock market terminology for beginners can be quite wide and comprehensive. But you need to be familiar with some important terms used in stock markets.
Above all, in the Indian context, you must know some stock market terms and definitions that are commonly used. It helps you build a better conversation around the markets.
Here are ten such terms that are unique to the market.
Table of Contents
Bull and Bear Market

Because markets often experience day-to-day (or even moment-to-moment) volatility, both terms are generally reserved for:
- Longer periods of mostly upward or downward movement
- Substantial upward or downward swings (20% is the widely accepted figure)
Beta and Alpha

Alpha is a measure of the success of your investment. It calculates how much a stock or fund has outperformed the general market. This follows the principle that when the market rises over time, it adds value to most of the stocks. This is called market return and is often adjusted with risk. However, there are many stocks that outperform, usually because of higher earnings. Their return is higher than the market. Alpha calculates this difference by comparing your stock or fund with a benchmark index. It, thus, represents how much value has been added or subtracted to total returns.
A stock or fund is thus given a positive or negative alpha value, denoted as a single or double-digit value. A positive value denotes outperformance, while a negative alpha means underperformance. A positive alpha of 3.5 means the stock has beat the index by 3.5%. Thus, every investor is ‘seeking positive alpha’.
Reading the alpha of a stock is important as it indicates the possibility of its success in the future, too.
While alpha deals with the rewards of the investment, beta gives perspective on the volatility or risks involved. Just like alpha, beta is also established by comparing it with a benchmark index. It measures the volatility in a stock’s price and is denoted in positive or negative figures. A positive beta value means that the stock moves in the same direction as the index. A negative value indicates an opposite direction; that is, the stock rises when the market falls and vice versa. Also, a beta value over 1 means the stock is more volatile than the market.
For example, if the beta value is 1.1, the share price is likely to swing more by 10% than the index. A value lower than 1 means the stock price does not fluctuate as much.
Thus, high beta values mean more risk. However, a smart investor can also use this to make gains.
Margin

Buying stocks that you can’t afford is known as margin trading. You buy stocks by paying a marginal amount of the actual value, which you can pay either in cash or in shares as security. Your broker funds your margin trading transactions, which you can settle later while squaring off your position. You make a profit when the profit earned is much higher than the margin; otherwise, you suffer a loss.
Day Trading

Day trading is the activity of buying and selling financial instruments (stocks, bonds, options, futures, or commodities) with the intent of profiting from price movements in the underlying security within a single trading day. While positions may be held for seconds to hours during the day, they are always closed out prior to the market close to avoid overnight exposure risk.
Entering a position (also known as opening a position) and then exiting the same position (also known as closing the position) is defined as a round trip.
For example, buying 100 shares of XYZ stock at ₹20 and selling 100 shares of XYZ stock ₹21 approximately 20 minutes later. Day trading is a series of speculative round trips executed inside of market hours.
Averaging
Averaging in the stock market is a bundle of comprehensive trading strategies that involve the fundamental principle of reducing or increasing your share prices to overcome market volatility. There are multiple kinds of averaging strategies a trader can use in a variety of market settings. For instance, in an emerging bull market, the price of a newly acquired unit decreases due to averaging.
On the other hand, in a falling market, an averaging strategy is employed to reduce one’s cost of loss, thereby making the units purchased higher in revenue.
Stop Loss

Stop loss is like insurance on your trade. Say you bought 100 shares of a stock at ₹90. If your maximum risk appetite is ₹1000, then your stop loss should be placed at around ₹80. At that point, the loss is booked, and the position is closed.
Stop losses are very common; in fact, they are a must in intraday trading as they protect against the risk of market volatility. When you buy a stock, the stop loss is below the buy price, and when you sell a stock, the stop loss is above the sell price. Short-term traders place bracket orders that have stop losses and built-in profit targets. If one of the orders is executed, the other leg is automatically cancelled.
Moving Averages
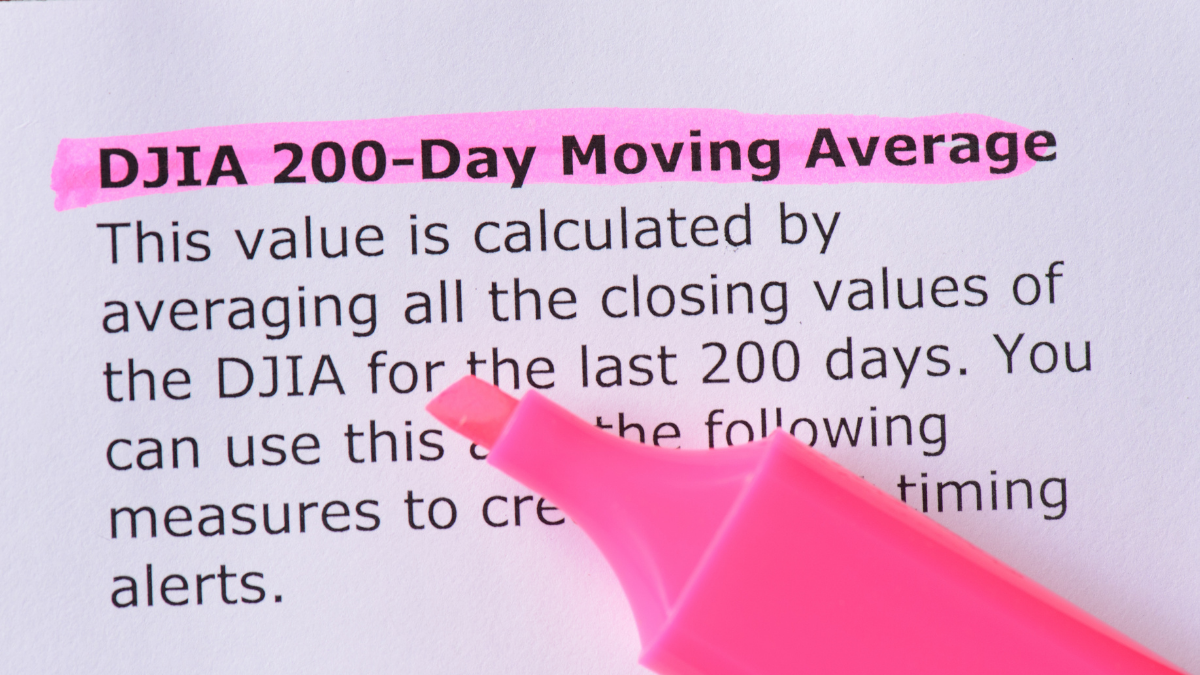
A moving average is a technical indicator that combines the price points of an instrument over a specified time frame and divides it by the number of data points to give you a single trend line. It is popular amongst traders because it can help to determine the direction of the current trend while lessening the impact of random price spikes.
Average = Sum/Number of Items
A simple moving average helps us interpret complicated indicators well, like exponential moving average and moving average convergence and divergence.
Bid and Ask

The exchange basically builds an order book. A bid is an offer to buy, and an ask is an offer to sell. When you want to buy, you will buy at the best (lowest) ask price. Similarly, when you sell shares, you will sell at the best (highest) bid price.
This is done automatically by the trading system at the National Stock Exchange (NSE) or the Bombay Stock Exchange (BSE). The combination of the best bids and asks form the order book for a stock.
Volatility
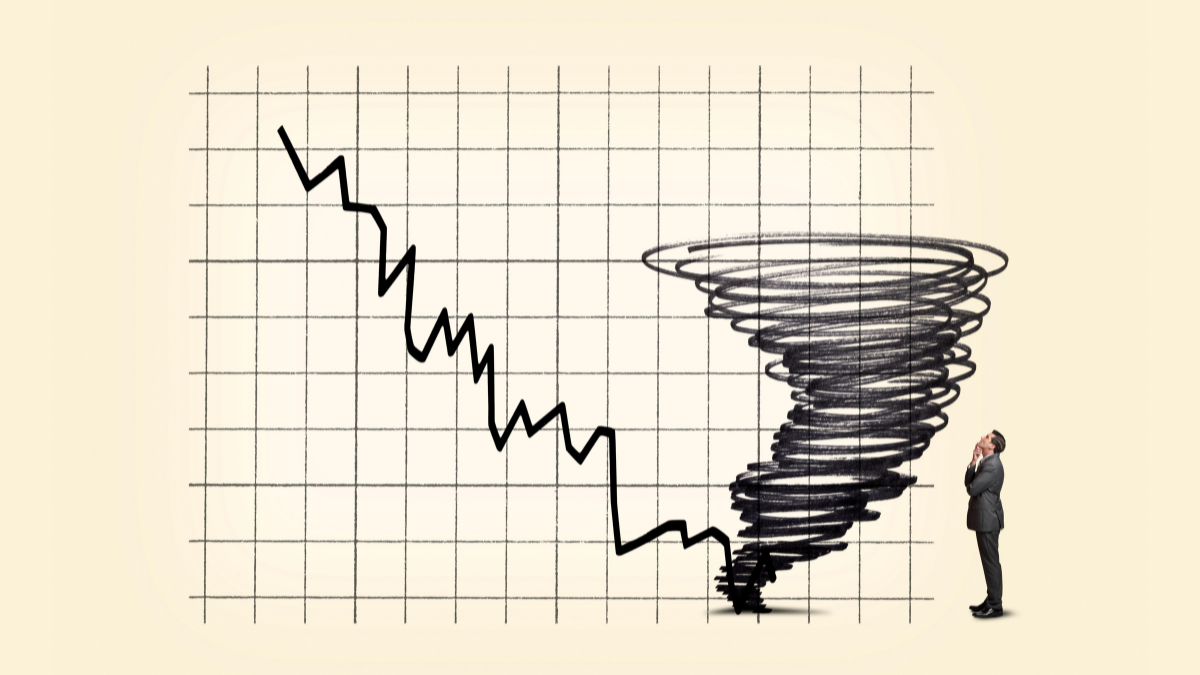
Volatility is defined as the rate at which the price of a security increases or decreases for a given set of returns. It indicates the risk associated with the changing price of the security and is measured by calculating the standard deviation of the annualised returns over a given period of time. In simpler terms, it is the gauge of how fast the value of securities or market indexes moves.
In the stock market context, rapid price fluctuation in either direction is considered as volatility. Therefore, a high standard deviation value means prices can rapidly rise or fall and vice versa. In most cases, a surge or dive of 1% in market indexes classifies it as a “volatile” market.
Algorithmic Trading

Algorithmic trading, or algo trading, is the hottest sensation in town. It entails placing automatic orders through algos. These are nothing but computer programs to automatically place orders at great speeds if certain conditions are met. The simplest form of an algo is a slice algo, which helps you get the best average price for buying and for selling. Algos account for a large chunk of institutional trades, and they are executed at machine speeds that humans can hardly imagine.
There are obviously a plethora of more terms on the subject of stock market trading. It is always advisable to understand the basics of trading before stepping into the world of finance.
Now that you know the basic terminologies of intraday trading, you can learn and evolve your trading strategy on the go.
Take your first step into the world of trading with Share India in less than ten minutes!
Disclaimer: Any advice or information in the post is general advice for education purposes only and is not responsible for generating any trading strategy for anyone. Please do not trade or invest based solely on this information.