 Overview
 Leadership
 CSR
CSR Equal Steps
 ESG
ESG News Room
 Investor Relations
 ISO Certification
 Calculators
 Margin Calculator
 Dividend Yield Calculator
 Options Calculator
 CAGR Calculator
 Trade Cost Calculator
 Trading Brokerage
 Demat Account Charges
 Other Trading Charges
The perfect trade in intraday trading lies in making the right move at the right time. For starters, an intraday trader must have a good understanding of the trading time frame and figure out how to make intraday trades with this knowledge. In intraday trading, time plays a crucial role, where time analysis and charts can be considered the major sources of reference. An intraday chart displays all the movements with respect to the time of a single-day trade. As a professional trader, you always need to look closely for opportunities in trade and evaluate the trade to estimate future market trends, irrespective of any random tips.
Daily charts, which reflect price fluctuations over a one-day period, are mostly recommended for use in intraday trades. There are useful resources to refer to perform short-term trades. However, some traders also analyse longer-term periods. It aids in a more accurate assessment of stock movement and provides a better picture of the different strategies of intraday trading.
Table of Contents
What Is Intraday Trading Time Analysis?
Entering and exiting on accurate time in an intraday trade is an art that will come through practice and research. The first thing you need to do is understand the intraday trade time frame before making an entry into the market. Check out different trades that professionals do. An intraday trade’s timing is limited and starts over each trading day.
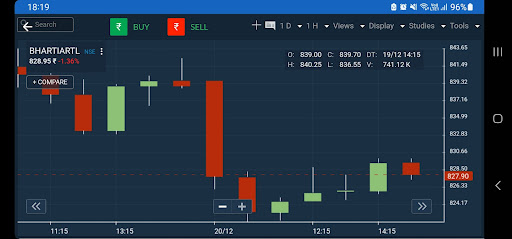
Intraday Hourly Charts
The hourly charts are one of the major time periods where the chart is broken into hourly segments. These hourly charts represent data from a single trading day, which is useful for analysing stock prices on the basis of hourly changes. You can check charts for the closing, highs, and lows of the stock at each hour for the time period.
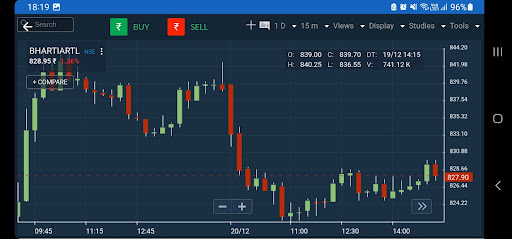
15- Minute Charts
A 15-minute chart shows movement in a 15-minute time frame for any securities. These charts display the open, close, high, and low prices of financial securities. This chart is useful for identifying 15-minute intervals, which can be useful for short-term trends in intraday trade. These 15-minute charts offer in-depth detail on stock price changes. So, if you want to analyse things closely, you can go with these 15-minute charts.
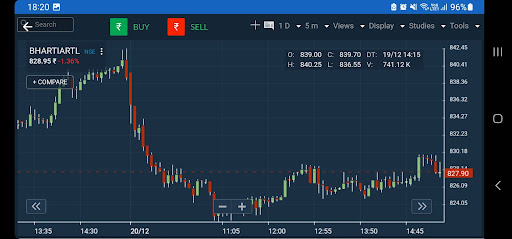
5-Minute Charts
Traders like scalp traders often use 5-minute charts. The short-term trader uses the miniature chart to mark their position and trade accordingly. The 5-minute chart is useful for quick scalps that can last for several minutes rather than hourly sessions in an intraday trade. A long-term trader can also use 5-minute charts to select an optimal point to enter or exit a trade while planning a long period of time.
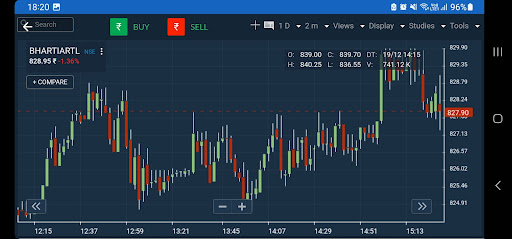
2-Minute Charts
A 2-minute intraday chart represents the price action of stocks for a few hours. The chart, similar to other charts, represents the same data. This chart is useful for traders who are looking for ultra-short-term investments. Short-term traders carefully analyse these charts and frequently update their trading positions in the stock market.
Tick Charts
Last but not least will be the tick trade charts. The tick trade chart represents every trade executed in the market. These charts are applicable when there is a high level of liquidity and show distinct ticks. This type of chart with continuous ticks is frequently used in highly liquid markets.
Intraday trading time is a crucial source for making trades in intraday trading. In the financial market, there is no best time for intraday trading in India. Accurate time analysis is an art and strategy that not all traders can master. All these time charts are commonly used, and the most skilled intraday traders have the possibility, although never a guarantee, of incurring good returns.
Observing a chart, you will come to see the line charts, which represent every trade that is executed on the stock market. If you choose a stock that has low liquidity, then the chances of returns are low. The movement in illiquid securities is like a flat line. Intraday traders seek to bet their money on volatile stocks that show constant movement in stock price; these movements can result in a good profit for day traders. Tick charts can be used for scalping and also keep out-of-money trades that need correction.
Types of Intraday Trading Charts
There are various charts for intraday trading. Depending on the stock broker’s software, you can get multiple types of trading charts. Some of them are as follows:
- Line Charts: These provide a quick overview of stock prices, which are shown in the line charts. It is popular among traders and investors.
- Bar Charts: In these types of charts, the stock’s open and close prices are represented in a bar form. Traders use vertical as well as horizontal bar charts to get the closing and opening values.
- Candlestick Charts: Another popular intraday trading chart is the candlestick chart, in which the highs and lows of the red and green candles can be seen. As a day trader, you can go with any type of trading chart, depending on your point of view.
What Is the Best Time Frame for Intraday Traders?
The ideal time for intraday trade is not fixed, but according to market research, intraday traders are most active between 10.15 a.m. and 2.30 p.m. The reason for this is that stock volatility subsides in the morning. As the closing time passes, traders need to square off their intraday positions, which can be done by 2.30 p.m., which is earlier than the official intraday time in India.