 Overview
 Leadership
 CSR
CSR Equal Steps
 ESG
ESG News Room
 Investor Relations
 ISO Certification
 Calculators
 Margin Calculator
 Dividend Yield Calculator
 Options Calculator
 CAGR Calculator
 Trade Cost Calculator
 Trading Brokerage
 Demat Account Charges
 Other Trading Charges
The prospect of making large profits in a short time frame is what attracts traders to intraday trading. In this type of trading, traders exit their trades on the same day, but trade in large volumes, which is why they are able to take home significant profits. However, the large volumes and short holding time period also make intraday trading very risky. Hence, it is a must to have a solid day trading and risk management strategy. Traders implement technical tools and indicators to construct such effective strategies. This blog will discuss one such technical tool called pivot points. You will learn about the mean of pivot points and how to use them for intraday trading
Table of Contents
Table of Contents
Meaning of Pivot Points
Definition or meaning of pivot point: The pivot point is a technical analysis indicator, which is calculated by calculating the average of the low, high, and closing prices of the previous day. These points are then plotted on the price chart, and you can then refer to plan your trading strategy. The pivot points give you an idea of the general trend of the overall market or a particular stock. If the price is trading above the pivot point of the previous day, that implies a bullish sentiment. On the other hand, if the price is trading below the pilot point, it indicates a bearish sentiment.
Besides that, pivot points also help you identify the potential levels of support and resistance on the price chart. Generally, there are seven point levels on a chart—The central pivot point or a primary pivot point in the middle and support and resistance levels on either side. Three levels of resistance are above the central pivot level, while the three levels of supports are below the central pivot point. Pivot level, while the three levels of supports are below the central pivot point. Price movement through these levels of support and resistance could bolster market sentiment.
How to calculate Pivot Points?
So, you know that the central pivot point is the average of the previous day’s high, low, and close. But let’s learn how to calculate the pivot levels that act as supports and resistances. Mathematically, the calculation of the central pivot can be represented as:
Central Pivot = P = High + Low + Close/3
Then,
R1 = (P × 2) − Low
R2 = P + (R1 − S1)
R3 = P + (R2 − S2)
S1 = (P×2) − High
S2 = P − (R1 − S1)
S3 = P – (R2 – S2)
Here, R stands for resistance, and S stands for support.
How to use Pivot Point in Intraday Trading?
Pivot point level—the central pivot point and the levels of support and resistance—is mainly used by intraday traders. As an intraday trader, you can use the pivot points to determine the entries, targets, and stops of your trades. As mentioned earlier, if the price opens and sustains above the central pivot level, it indicates bullishness. Conversely, if the price opens and trades below the central pivot level, it indicates bearishness. So, let’s understand how to use pivot points in intraday trading with the following example.
Suppose the price of the stock opens and sustains above the central pivot level; the intraday trader senses bullishness around the stock. So they may wait for the price to cut above the first resistance (R1) to take a long position. The trader’s first target could be resistance two (R2), and the second target could be resistance three (R3). On the other hand, the trader could place their stop loss order below the first resistance.
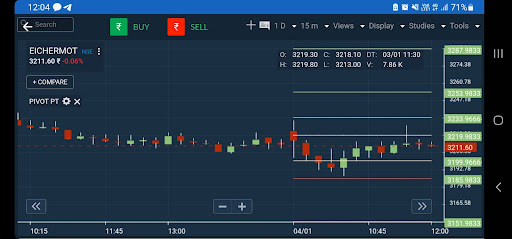
In the above image, the black line portrays the pivot levels on the day chart. Now let’s look at two popular pivot point strategies that you can implement: the pivot point bounce and the pivot point breakout.
Pivot Point Bounce
The pivot point bounce is a strategy that tells you when to enter and exit a trade, or, in other words, when to buy and when to sell. If you’re taking a long position, you buy at the support and sell at the resistance. The rationale behind the pivot [point bounce is that the stock price is likely to bounce off support and resistance levels. So, if the stock’s price bounces off a pivot level and starts moving upward , you can consider buying stock. You can then consider selling it when it is about to experience the next level of resistance, which is represented by the pivot level above. You can always keep your stop below the bounce pivot level to limit the downside if things don’t go as planned.
The reverse is true if you are shorting the stock, i.e., you sell the stock as its price bounces downwards off a resistance level, and you buy it back and exit your positions as the price heads closer to the support.In this case, you can place your stop loss just above the resistance pivot level from which you entered the trade
Pivot point breakout
The other popular pivot point strategy used by intraday traders is the pivot point breakout strategy. This strategy involves capitalising on a breakout above a resistance level or a breakdown below a support level, as it may lead to sharp price movements. Generally, we expect the price to fluctuate in range, bouncing off the support and resistance levels. However, the price can sometimes break out by cutting through the resistance and soar upward. Likewise, the price can show a breakdown if it cuts below the support.
So, in the case of a breakout, you go long and buy when the price cuts above a key pivot level, acting as the resistance.Shorting a security occurs when the price falls below the key pivot level that serves as support. You can then consider booking partial profits as the stock price continues to soar upwards or plummet downwards. When it comes to placing stops, in the case of a breakout, you could consider placing a stop loss order below the breakout pivot level that acted as the resistance. Similarly, for breakdowns, the stop loss can be placed above the pivot level, which serves as support prior to the breakdown. Don’t let your finances get the best of you. Use our range of online financial calculators to take control of your money today.
Why Is Pivot Point Trading Important?
So, pivot points can help intraday traders identify the trend and the levels of support and resistance , and based on that, they can decide their entries, targets, and stops. Unlike indicators like moving averages or momentum oscillators, price movements and the passage of time don’t influence the pivot points for a particular day. Since the pivot levels are fixed for the day, the trader will also find it easier to determine fixed entries, targets, and stops. This can help new traders maintain trading discipline.
At the same time, pivot points qualify as leading indicators. That is because the previous day’s data is used to calculate the pivot levels for the present day to predict the potential price action. While moving averages and momentum indicators are lagging indicators, they do not help predict where the price will be heading next but confirm the trend of the price. However, remember that the pivot levels are only applicable for the present trading day. Learn how to get started with delivery trading and start enjoying the benefits of this innovative new way to invest.
Conclusion
You can add the pivot point indicator to start pivot point trading on your Share India App by selecting the studies tab on a price chart and then entering the pivot point. These pivot points give you seven levels to work with as a trader, so they prove to be very useful. However, remember that you must look at the levels in relation to the price. For example, suppose you are executing the pivot point breakout strategy, and you take a long position after the price breaks RI. Now that the price has risen above R1, R1 will serve as support Lastly, like every indicator, pivot points,, are just indications; and there’s no certainty, so it’s best to have a risk management plan ready.